Malu Araujo
  • Home
  • About me
  • Skills
  • Portfolio
  • Contact

+1 (707) 920-2500

mluizzasoares@gmail.com

Portfolio

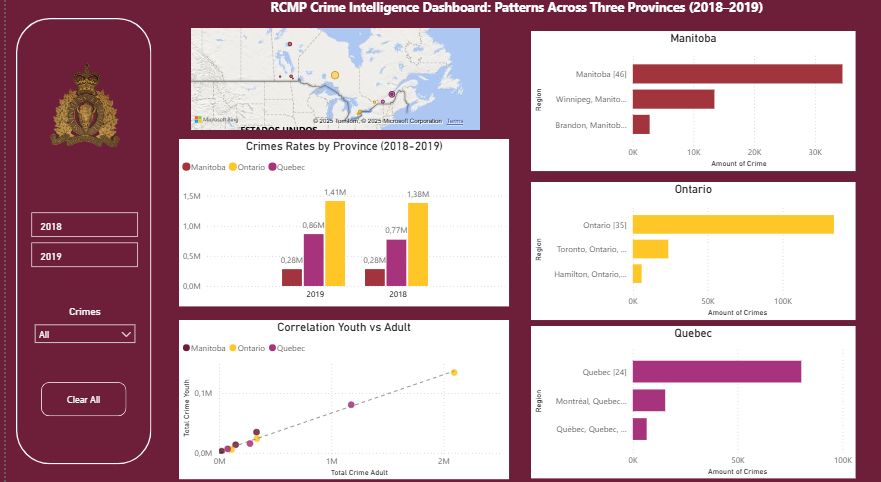
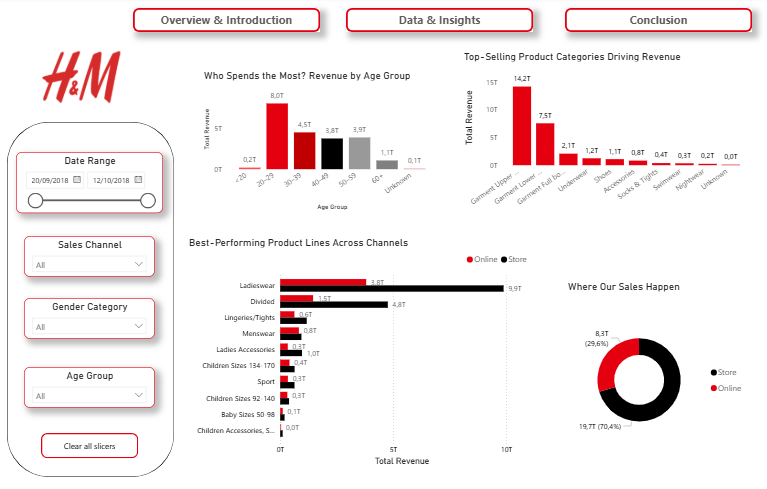
A showcase of my work in transforming raw data into meaningful stories through dashboards, reports, Python, and SQL.

Data Dashboards Analytical Reports Python Solutions SQL Insights HTML Development
Tableau – Customer Churn Prediction
A visually compelling Tableau dashboard predicting customer churn, merging statistical modelling with sleek visual storytelling.
Tableau — Formula 1 Performance & Strategy
Multi-view analysis of drivers, teams, pit strategy, and global circuits, combining ranking timelines with spatial context for rapid race insights.
Excel – Spotify Analysis
An Excel-based analysis of Spotify data, showcasing trends in listening habits, top artists, and seasonal patterns.
Power BI – Business Insights
An interactive business intelligence dashboard crafted in Power BI, designed to uncover trends and guide strategic decisions with clarity.
Power BI — RCMP Crime Intelligence Dashboard
Power BI — RCMP Crime Intelligence
Provincial crime trends (2018–2019) with interactive filters, geo-mapping, and comparative KPIs to support evidence-based policing insights.
Power BI – Business Insights
Power BI – H&M Analysis
An interactive Power BI dashboard analysing H&M Group’s sales, customer behaviour, and product performance to reveal key trends and support data-driven decisions.
Doctorly – Business Growth Strategy
Growth and monetisation strategy for the Doctorly channel, with revenue diversification and a data-driven approach.
Report
South Korea Culture Over Time – Google Trends
South Korea Culture Over Time
Global Google Trends comparison (2015–2025) of ‘Seoul,’ ‘Skincare,’ ‘K-pop,’ and ‘K-drama,’ highlighting the worldwide rise of Hallyu.
Report
F1 Race Talk on Twitter – NodeXL
F1 Race Talk on Twitter
#ImolaGP conversation map on X/Twitter, visualised with NodeXL, revealing key discussion clusters, top influencers, and engagement patterns.
Report
Amorepacific – Innovation Survey
5-week internal innovation survey across R&D and Analytics, paired with a clear logic model to drive actionable insights and growth.
Logic Model
Report
From Traffic to Conversion – Dashboard Review
From Traffic to Conversion
Marketing performance diagnosis with actionable recommendations to shift from basic reporting to strategic, insight-driven management.
Report
Balenciaga Children Scandal Report
Balenciaga Children Scandal
In-depth analysis of Balenciaga’s late-2022 campaign controversy, exploring public backlash, brand response, and key crisis communication lessons—featuring Google Trends insights and an audience survey link.
Take the Survey
Report
AWS DeepRacer
Reward functions and helpers for autonomous racing. Click to open the repository and read the code.
GitHub Repo
World Happiness Project
World Happiness
Exploratory analysis and visuals on factors correlated with happiness scores.
GitHub Repo
Netflix Streaming Analysis
Netflix Streaming
Data analysis of the catalogue and trends using Python and Pandas.
GitHub Repo
Students Performance Analysis
Students Performance
Statistical insights into test scores and student factors; EDA and modelling.
GitHub Repo
Applied Activity 2 (Basic SQL)
Offices DB Analysis
Table creation for departments, joins with employees and offices, and identification of employees without a direct manager (manager_id IS NULL). A good practice for DDL + JOINs.
GitHub Repo
Final Exam (Healthcare DB)
Healthcare DB
Modelling and creation of the healthcare database (PKs, FKs, weak entities), data loading, and analytical queries: counts by gender/hospital, revenue by insurance, admission dates, and more.
GitHub Repo

Dataset creation

Analysis queries

Report
Compliance Transfer Checks
Compliance — Transfer Checks
Compliance query to monitor transfer values by hour, day, and week with aggregations, time windows, and thresholds for automated alerts.
GitHub Repo

Employees Transactions

Employees > 10k

Metrics Employees

Wallet Balance

Transactions
Amorepacific – Innovation Survey
Website that projects a 5-week internal innovation survey across R&D and Analytics, paired with a clear logic model to drive actionable insights and growth.
Logic Model

Report
First HTML Portfolio – Collect Data Project
My first portfolio project was developed during the Collect Data class, combining Python for data collection and HTML for presentation, showcasing structured datasets and visual storytelling.
Portfolio
© 2025 Maria Luiza de Araújo. All rights reserved.